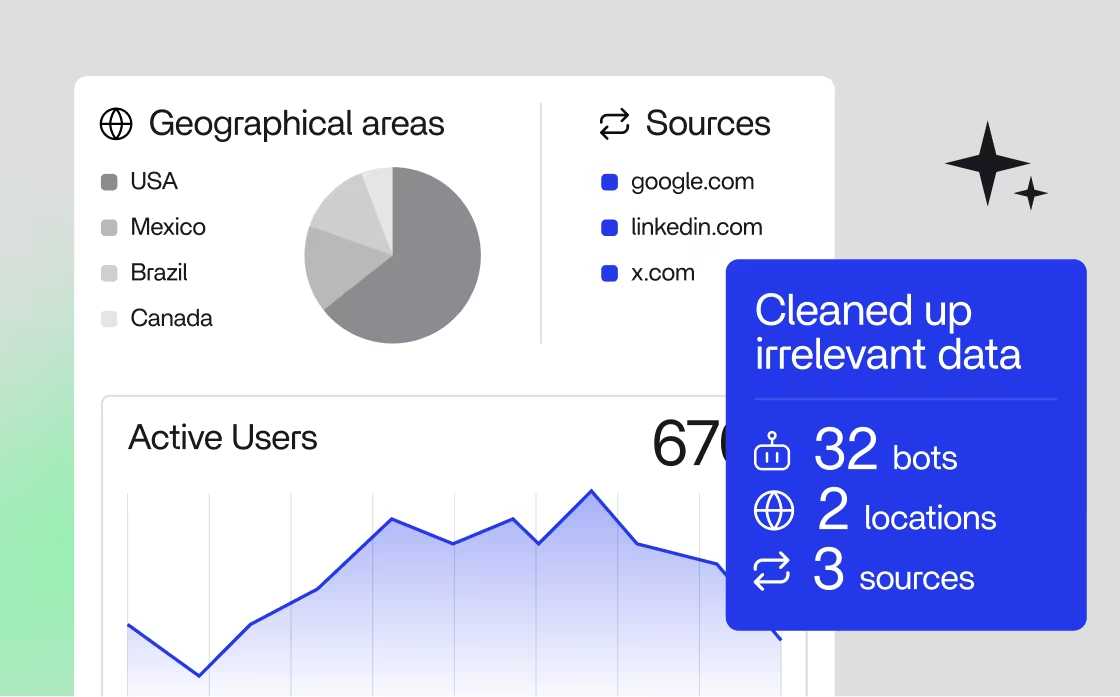
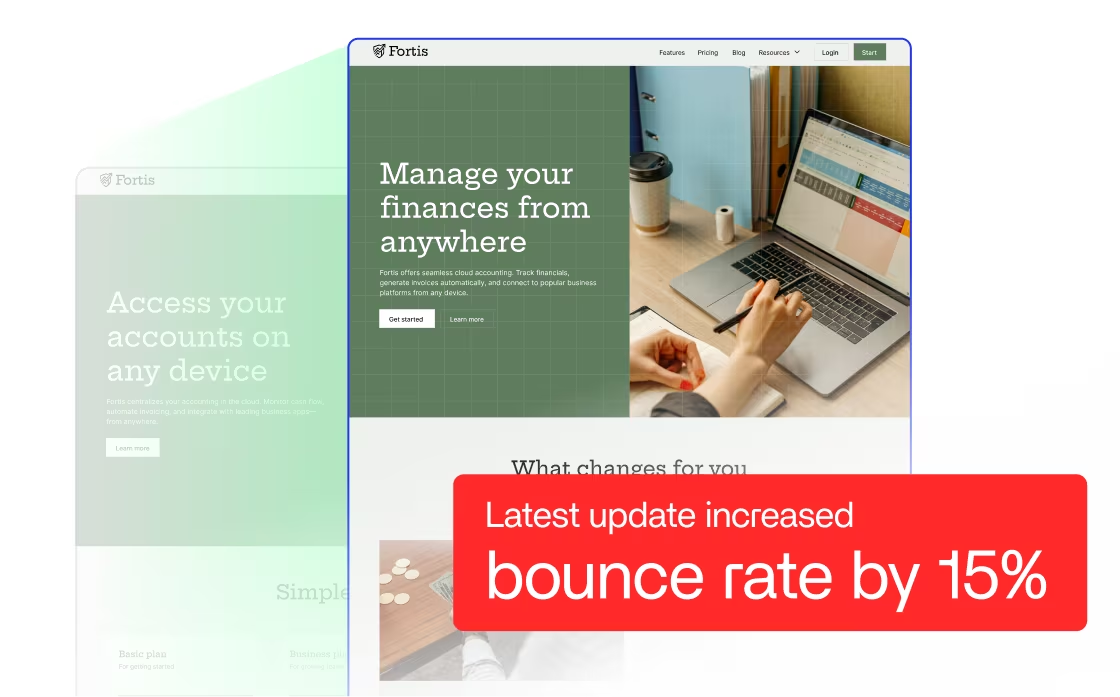
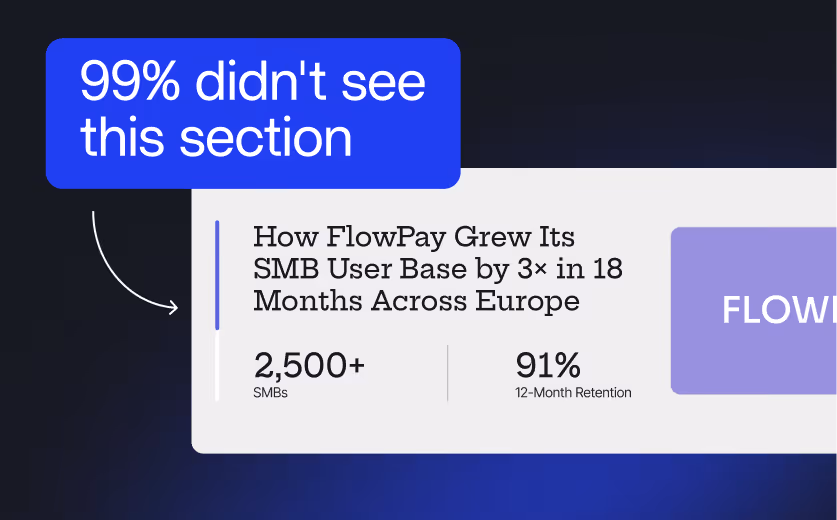
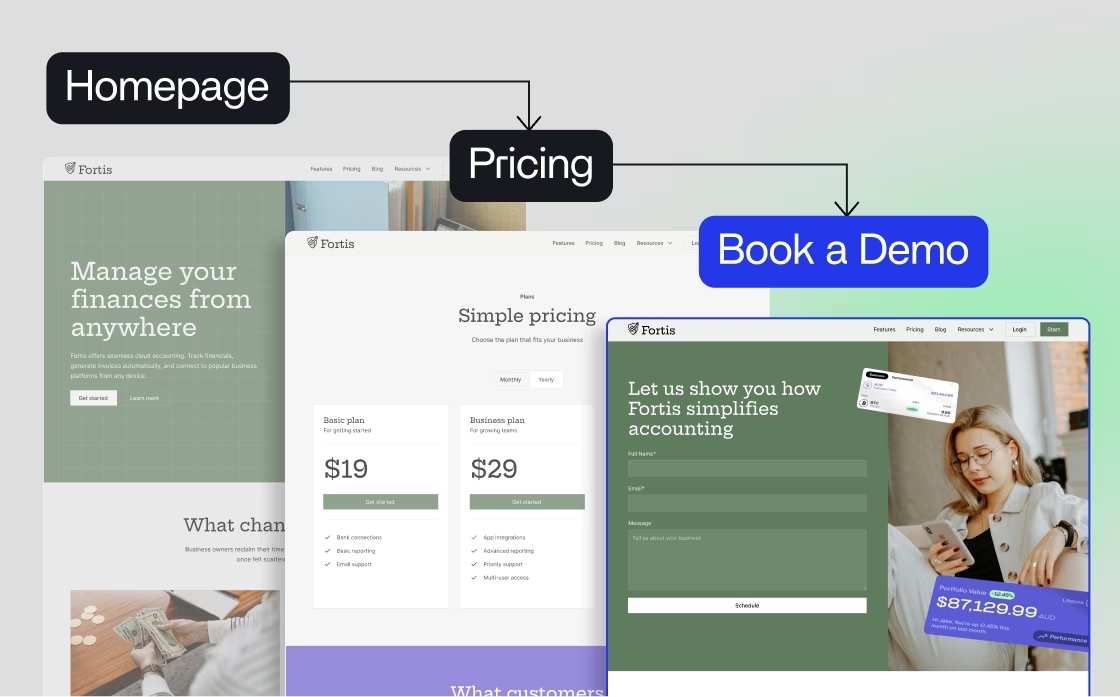
norta.signal logo

Your website is constantly collecting signals you don't have time to discover.

For startup marketers, the data is not the problem. Conversion signals, engagement patterns, account-level intent, it's all there, accumulating. The hard part is keeping up with it consistently, week after week.

That's exactly the gap norta.signal fills.

How often is the data your website collects actually analyzed?

The website keeps generating signal. The signal keeps going unheard.
What does the journey of a successful conversion look like?
Which campaigns drive the most engaged traffic?
How much impact has each website change made?
How did the last conference’s landing page perform?
Which type of blog post performs best?
Are there parts visitors never get to see?
What does the journey of a successful conversion look like?

Is the website a nice brochure or a powerful demand gen engine? The difference is what you do with the data it collects.

The data is never the problem. Having someone on it is.

A sharp, AI-powered human that continuously digs through your website data and always surfaces what matters most.
That's what norta.signal is.

Here's what it looks like in practice

Once a week, you’ll get a clear briefing over a 30min call and a walkthrough of what we have found. After the call, you’ll get an up to date report to help you make the next decisions.

Track landing page performance of every campaign

Three overlapping web pages showing financial management and accounting with total views and conversion rates: 5,780 views with 6% rate, 15,326 views with 12% rate, and 245 views with 0.6% rate.

Always look at clean data

Dashboard showing geographical areas with a pie chart for USA, Mexico, Brazil, and Canada, sources including google.com, linkedin.com, x.com, and a data summary stating 32 bots, 2 locations, and 3 sources cleaned up.

Option B title performed 20% better

Heatmap showing Option B with a 5.82% CTR, which is 38% higher than Option A's 4.21% CTR.

Keep tabs on the impact of every change

Website screen with text overlay stating latest update increased bounce rate by 15%.

Which part of the message visitors don't see

Annotation pointing to a section stating FlowPay grew its SMB user base by 3 times in 18 months across Europe with 2,500+ SMBs and 91% 12-month retention.

Most common conversion journey

Diagram showing website navigation flow from Homepage to Pricing page, then to Book a Demo page with screenshots of each page.
You're not digging into the data. The data is coming to you.
Filtered, contextualized, and ready to act on.
norta.pro logo

From data to action

Most analytics services hand you a report and leave. norta.signal is backed by a decade of startup design experience, which means when the data points to a problem, we already know how to solve it. Faster from signal to fix.

No handoff. No briefing a new team from scratch.

Works with the tools you already have.

No new platforms to learn. No ripping out your existing stack. If you have GA4 installed, you're already most of the way there.
That's it.
No technical
overhaul.
Google Analytics 4
traffic, behavior, conversions, and funnel data
Hotjar or equivalent
heatmaps, session recordings, and scroll depth
RB2B or equivalent
visitor and company identification
We connect to your existing setup, complete a quick onboarding and get to work.

Your visitors have been busy. Let's see what they're up to.

$2,500
$1,000/mo
Limited availability

Early access | Cancel any time

Thank you!
Your submission has been received!
Oops! Something went wrong while submitting the form.